
Although my title at Stanford School of Medicine is writer, I’ve found that medical information is often just too wordy and complicated to communicate through text alone. This is especially true given that patient education materials are targeted to an eighth-grade reading level.
I’ve undertaken two major efforts in this regard:
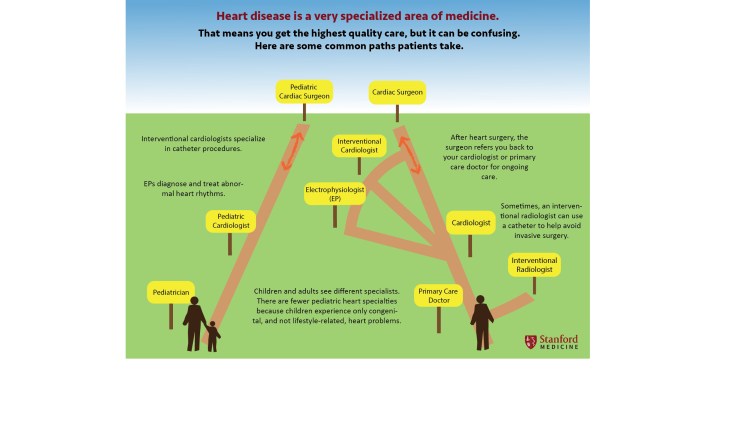
(1) a chart that shows how patients may be referred when dealing with a cardiovascular medical problem. This stemmed from overhearing a constant stream of phone calls to surgeons in which patients would ask the surgeon for a refill of their blood pressure or other everyday medication.
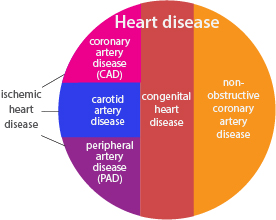
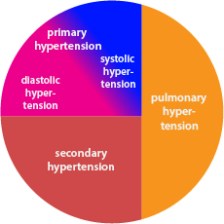
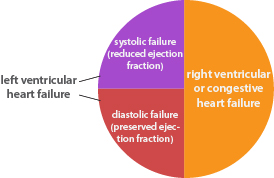
 (2) an effort to show patients how the words they may have heard from different doctors may be the same, similar or different. If one doctor uses one term and another uses another, the patient may be left believing that they have gotten two completely different diagnoses, when in fact it may be a question of nuance or even simply of different linguistic choices on the part of each doctor. These illustrations are designed to accompany a text-based glossary.
I welcome feedback you may have about how successful these infographics are.

